Comics are not just for kids—they’re also a great format for telling science stories. If you need more convincing, we recommend you read Jane C. Hu’s foray into why you should consider comics for science journalism.
Of course, it’s one thing to know conceptually how words and images can work in tandem to create a narrative. It’s another thing to put pen to paper (or drawing tablet) and start making illustrated science stories. Luckily, you don’t need the artistic abilities of Leonardo da Vinci to be a graphic journalist. Although great graphic journalism takes practice and hard work, the goal isn’t to make museum quality pieces, but to tell a story.
If you feel inspired to take on this creative challenge, here are some suggestions for getting started.
Picking Stories to Tell Visually
When deciding whether to tell a science story through graphic journalism, it helps to consider whether your story has certain aspects that would be enhanced by a visual medium.
People are naturally drawn to human faces from infancy. If your science story focuses on compelling characters, depicting their faces, expressions, and emotions in a drawing may grab readers’ attention faster than a well-written description. Visual formats can also give readers space to digest dense information dumps, such as paragraphs heavy on facts or numbers. Detailed explanations of complex ideas can be concisely represented as graphics that give readers an extra dimension of understanding through colors, shapes, sizes, scales, and spatial relationships.
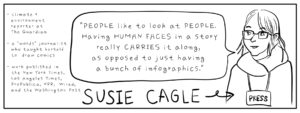
Susie Cagle, a self-described “words” journalist turned comic journalist who covers environment and climate at The Guardian, notes that stories with data or statistics are also strong contenders for the graphic journalism treatment because numbers can be easier to understand or more interesting when displayed visually than when described by long swaths of text or a more traditionally styled infographic.
For a Longreads story about dwindling drinking water resources in drought-plagued California, Cagle wanted to highlight changes in groundwater, which was disappearing, and precipitation, which was becoming more erratic. She drew key numbers in charts that she superimposed on water barrels and orange crates.
“It’s about making those graphs a little more visually fun,” Cagle says.

Tools of the Trade
There’s a vast range of art supplies available to artists for doing graphic journalism. Some graphic journalists opt for an old-school approach, using pen, marker, or paint on paper. Others work on a digital canvas, using styluses and tablets that sense the pressure and direction of each pen or brush stroke and display that information as pixels in graphics-editing programs such as Adobe Photoshop and Procreate. The choice is largely a matter of personal preferences and workflow.
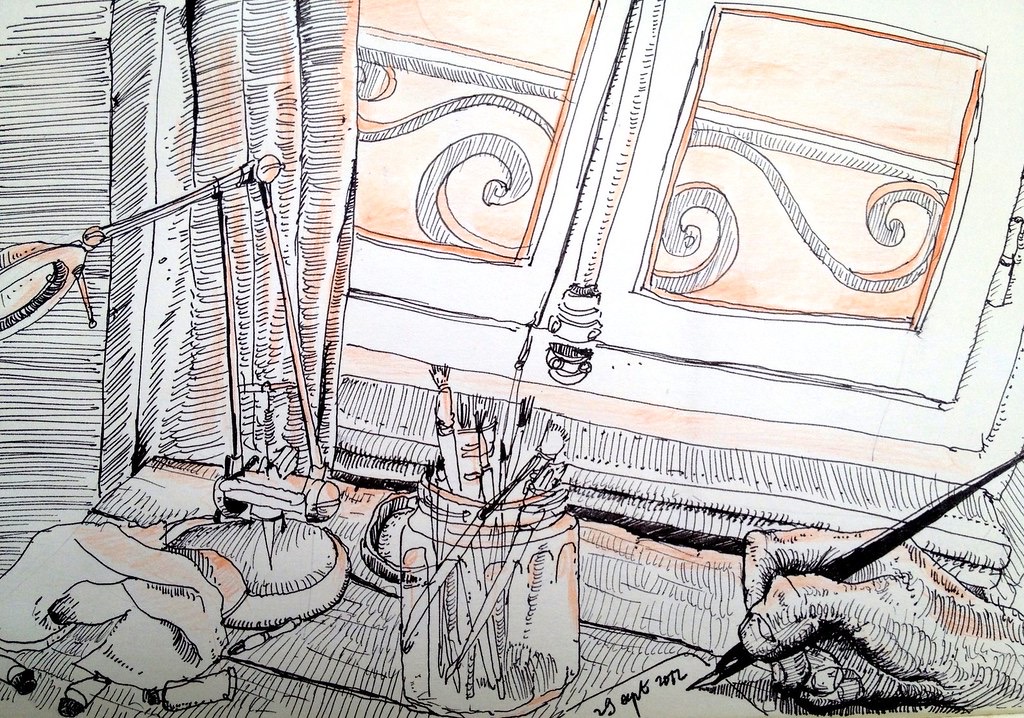
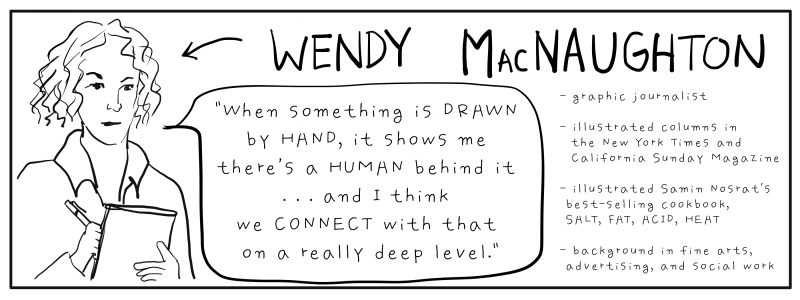
Wendy MacNaughton, a graphic journalist with columns in The New York Times and The California Sunday Magazine, describes her work as “illustrated documentaries” that capture reported scenes. MacNaughton draws on location using pen and paper, which she says forces her to commit to each observation she makes. There isn’t the temptation to erase or rehash lines, unlike with pencil. Her sketches are full of expressive, confident lines. “If I notice the sharp angle of somebody’s shoulder, I’m going to … make two hard lines that connect at a point,” MacNaughton says. Drawing without erasing, she says, “captures the energy of the moment.”
MacNaughton’s live sketches each take anywhere from one minute to 20 minutes to complete. Back in her studio, she adds watercolor to her field sketches and works on more detailed portraits from reference photos taken on location. The text, which MacNaughton letters by hand, comes from transcribed interviews and is sometimes verbatim, sometimes paraphrased. MacNaughton scans the colored sketches and portraits and handwritten text into separate digital files, which she assembles like a digital scrapbook into the final product.
While traditional drawing methods like MacNaughton’s are good for capturing the spontaneous energy of moments in time, digital drawing tools can help illustrators work on a faster timeline. Digitally, it’s possible to remove, redo, and resize images with a click of a button.
Cagle uses both traditional and digital drawing tools in her workflow, depending on which stage she’s at. First, she sketches on paper to lay down her ideas and plan what the entire project will look like and how she’ll fill the space. As Cagle draws, she concurrently writes a script that she ruthlessly pares down to go with her sketches. This process yields a sequence of tiny “thumbnails,” a first draft of illustrations, and the text that will go with each image.
Cagle usually limits herself to about 30 words per illustration, to maintain visual balance.
Once she and her editors have agreed on the layout, it’s time to move to digital. Cagle takes pictures of her tiny sketches and imports them into Photoshop. She redraws each sketch to scale, makes a clean version of the line art in a separate layer, and then colors her drawing on yet another layer. The layers act like transparent plastic sheets stacked one atop the other on an overhead projector to form a complete image. Cagle can make changes to one layer of a drawing without disturbing the rest. The accompanying words go in a separate layer, so they too can be changed without affecting the other layers.
Still, the comic journalist’s most important tool, as with written journalism, is the power of observation.
“It’s the art of being curious, of noticing things that are metaphorical, that seem like they have a story behind them, that [seem] completely out of place but have a reason for being there,” MacNaughton says. She’s always on the lookout for those small details. Once, for example, while reporting on a prison hospice-caregiving training program, she saw an incarcerated trainee carrying a homemade cardboard briefcase. “That briefcase said so much about who that man is and how he feels about the work he’s doing—it adds so much to the story,” MacNaughton says.
Getting Comfortable with Drawing
It’s not necessary to have an art background to try illustrated storytelling. As children, we draw without feeling self-conscious. As we get older, we often worry that everything we draw has to look perfect—a worry that can stymie creativity. But there are ways to escape this mindset.
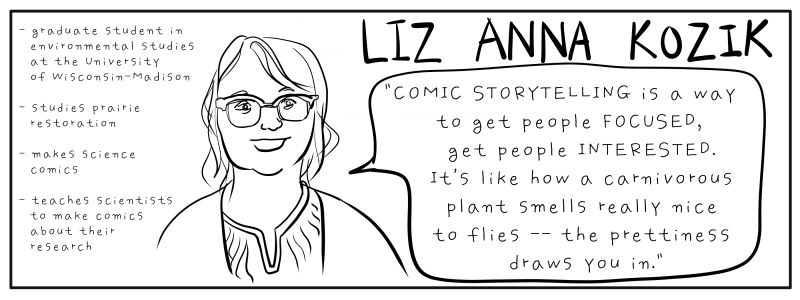
Liz Anna Kozik, a University of Wisconsin–Madison graduate student studying the cultural and scientific history of prairie restoration, periodically holds workshops where she teaches scientists interested in science communication how to draw. The workshops start off with an icebreaker exercise: Everyone draws Batman in 90 seconds. Then one minute. Thirty seconds. Fifteen seconds.
The results are funny and rarely heroic. Some renderings of Batman have exaggeratedly large, pointy ears on their hoods. Others are blobby beneath their capes, or have ropey arms and legs.
“But everyone knows it’s Batman,” Kozik says.
The exercise shows her students that they can draw well enough to “convey the idea of Batman,” she says. It’s a confidence booster for anyone who feels their art isn’t good enough. And it drives home an important point to anyone nervous about trying visual science storytelling, whether they’re artists, researchers, or journalists: Making comics is less about excelling at the conventions of fine art than it is about “draw(ing) concepts so other people understand what you’re trying to say.”
MacNaughton, who also teaches graphic journalism to illustrators and journalists, uses an exercise in blind contour drawing to help beginning artists reconsider their notions of what counts as a good illustration. She has students sit across from each other in pairs and spend one minute drawing each other without looking down at the sketch or lifting the pen from the page. “You’re going to draw the worst drawing you’ve ever drawn in your life,” MacNaughton tells students. “And at the same time, it’s going to be great.”
The goal of the exercise is to slow down and “uncouple” our ideas of what a drawing should look like from the physical act of drawing what we see, MacNaughton says. “You’ve stopped thinking about what you’re supposed to be drawing, what your friend’s face is supposed to look like on a piece of paper, and you’ve started actually moving your hands with your eyes—seeing all the shape and light and line and detail that is really there.”
If you’re still stuck and need a starting point, Kozik has a method, which she developed with Holly Kerby—a chemist, playwright, and founder and executive director of the Madison, Wisconsin–based outreach program Science Fusion Theater—to help scientists structure their research into illustrated stories. Kozik gives researchers 10 drawing prompts—Draw yourself! Your research subject! What success and failure look like!—and a stack of index cards, with instructions to draw one prompt per card per minute. Then participants shuffle their cards around to create a story.
Deciding What to Illustrate, and How
Graphics have their own visual language. How you draw depends on what you’re trying to convey in a frame or in the piece as a whole. If you’re trying to direct readers’ focus to particular aspects of a scene, for example, you might include more details to make your subject stand out and simplify the rest of the sketch with contour lines, or a muted palette.

When Cagle was reporting for The Guardian on the divided attitude towards eucalyptus trees, which have been implicated in fueling wildfires across the world, she used the format to zoom in on the details she wanted readers to focus on. Using inset panels to magnify the oil-rich branches and leaves and shredded ribbons of dried bark that could easily catch fire and be carried by the wind to start more fires, Cagle directed our attention in a way to explain why eucalyptus trees are so flammable.
In another example, in a 2015 Nature comic looking back at 25 years of international climate talks leading up to the Paris climate agreement, authors Richard Monastersky and Nick Sousanis deployed a series of little inset calendars at different points in their timeline, each stamped with the date and the corresponding concentration of carbon dioxide in the atmosphere. The repetition not only showed readers how greenhouse gases kept increasing because of political inaction, but also upped the ante and evoked a feeling of urgency.
Comic journalists can also use art styles to set a story’s tone or evoke a specific mood. For example, Kozik’s ecology-themed comics often favor a muted, earthy palette. And she purposely avoids using harsh lines or right angles and opts instead for soft, rounded strokes to make her science illustrations look more inviting and less clinical and intimidating.
Ultimately, figuring out your voice and visual style takes trial and error and comes with practice, Cagle says. As she puts it, “You’re dealing with two languages that work together to create yet another language.”
Finding Partners
Since most major newspapers and online media outlets have published comic journalism, editors are generally familiar with the idea and receptive to pitches, says Andy Warner, The New York Times best-selling author of Brief Histories of Everyday Objects and a contributing editor of the online comic journalism hub, The Nib. “The best way to pitch an editor is to explain why something is interesting and why you’re able to tell its story. Tell the editor who you’re going to talk to and if you have expertise, lay it out,” Warner says. “Don’t send already thumbnailed stuff because it’ll probably have to be reworked in layouts.”
MacNaughton, though, says she sometimes pitches a finished story if the editor or outlet is unfamiliar with her work. For journalists interested in taking a first stab at graphic journalism, she recommends picking a favorite outlet to pitch to, regardless of whether they’ve published drawn journalism before.
For journalists who have no desire to draw, collaborating with illustrators offers an opportunity to make graphic journalism without picking up a sketchbook and pen. For example, freelance illustrator Maki Naro and freelance science writer Matthew Francis, frequent contributors to The Nib, often collaborate. Other times, teams are paired together by editors putting together a story.
Dedicated comic journalism hubs such as The Nib or Vox’s The Highlight are great places to look for illustrators, as well as to study the form to better understand how illustrations can enhance stories, help with pacing, and mingle with text to convey more information than illustrations or words can on their own. Many freelance illustrators also display their work online.
Cagle suggests that journalists who want to work with an artist to make comic journalism can take one of two routes. They can either dictate their vision to an illustrator who does the drawing, or collaborate with a cartoonist who understands how to take the journalist’s reporting and write for comics. Cagle recommends seeking illustrators who are excited about prospective journalism projects. It’s not enough that they “have the chops to paint a pretty picture” of what journalists are writing about, she says. You want to find storytelling partners with whom you can create narrative synergy through words and pictures.
Jennifer Lu is a TON early-career fellow sponsored by the Burroughs Wellcome Fund and a data graphics journalist at the Los Angeles Times. She previously reported on the environment at the La Crosse Tribune in Wisconsin. Her work has appeared in National Geographic, Popular Science, Audubon, and other outlets. Jennifer can be found on Twitter @jenpenned.